

“Changing mobility” – it was Phil Goodwin some years ago who highlighted the double meaning of ‘changing’ in a phrase like this (one of many insights from Phil that have stuck with me). It can be an adjective (mobility is changing) or a verb (mobility can be changed). The fact that mobility is changing points to a dynamic that can be worked with in relation to policies to (further) change mobility in ways that seem appropriate.
In the early part of this millennium there has been cause for some optimism (at least to my mind) in relation to the dynamics of mobility. It can be (or could have been in 2014) summarised as follows:
“Society is becoming more urbanised. Car traffic has stopped growing. Young people’s driving licence holding is in decline. Fewer car trips per person are being made.”
In tracking financial market trends, a trend change is called a reversal. However, there can be temporary changes within a larger trend, called retracements (https://www.investopedia.com/articles/trading/06/retracements.asp). In this article I consider whether each element in the summary statement above constitutes a trend reversal or perhaps only a retracement.
When coining the phrase ‘peak car’, Phil was careful to point out that this was not necessarily to suggest that car use had peaked but rather that it should be seen as a shorthand for confronting uncertainty over whether or not car travel has peaked (see later). Phil and I ran a roundtable on ‘peak car’ in 2014 as part of work for the New Zealand Ministry of Transport. We called the roundtable report, ‘Grow, peak or plateau – the outlook for car travel’ in recognition of the uncertainty. In effect, the implied question left unanswered was ‘is the trend change in mobility depicted by peak car a trend reversal or (merely) a retracement within a larger trend that continues?’.
Looking at matters now in 2019 (drawing in particular upon the UK Department for Transport’s road traffic estimates and National Travel Survey data) there is cause for considering that in contrast to the optimism above, the position as it currently stands could be summarised as follows:
“Society is not becoming more urbanised. Car traffic is still growing. Young people’s driving licence holding has increased. More car trips per person are being made.”
Should we be contemplating that the overall picture for mobility is less transitional or messier in transition than earlier optimism might have suggested? To explain the basis for the two contrasting summary statements above, I now address their four elements in terms of available data.
Is there a trend of society becoming more urbanised in the UK?
In fact, in recent decades it is a myth to say that UK society (overall) has been becoming more urbanised. It’s a trap I confess I have previously fallen into. There is a distinction between our towns and cities growing and the share of society living in towns and cities growing. The size of the UK population grew from 56 million to 63 million between 1981 and 2011. In 1981, 73% of the UK population lived in major, large or small cities or large towns (with the remainder living in small towns and rural areas). In 2011 (the last 10-yearly census), this share was 71%. Unless the next census shows otherwise, we have been experiencing urban growth due to population growth but not urbanisation growth. Indeed if anything, modest urbanisation decline has been taking place.
Has car traffic stopped growing?
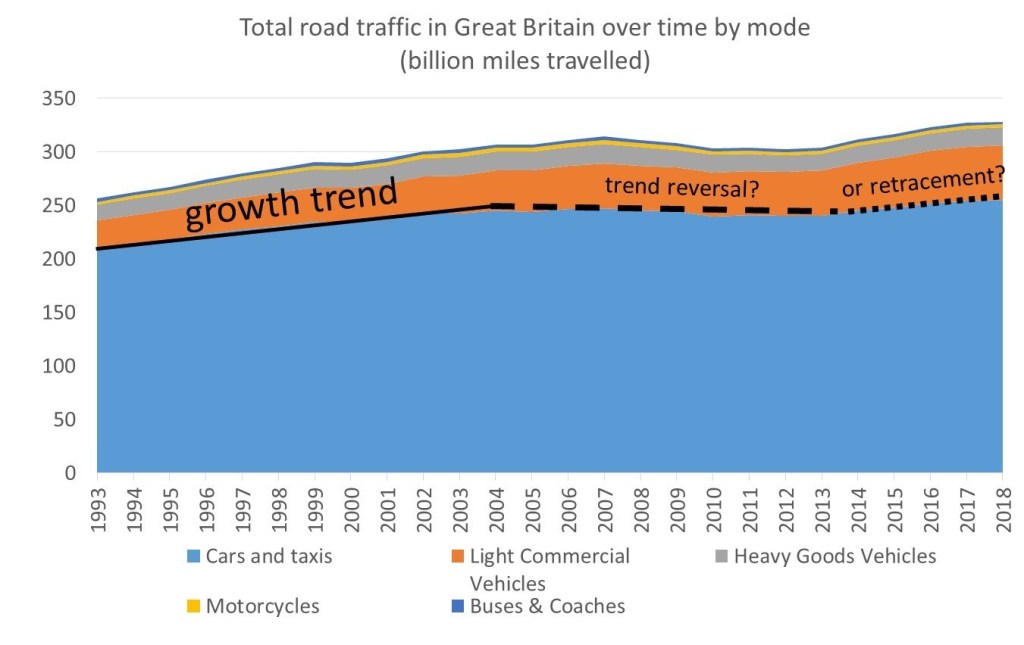
The graph above (produced using data table TRA0101 from the DfT) indicates that after a 10-year period (2004-2014) of a counter to the growth trend, growth in car traffic (and in total traffic) has resumed. 2018 marks the highest ever recorded estimate of car (and taxi) traffic – 255 billion miles. The graph shows total traffic by each mode. From 2004 to 2014, distance by car per person was falling, countering population growth. From 2014 to 2018 “growth in car traffic outstripped population growth, indicating an increase in average car driver distance” (Road Traffic Estimates: Great Britain 2018). The graph points to a revised unanswered question on peak car: “is the recent period of growth a continuation of the longer-run growth trend (suggesting 2004-2014 was (merely) a rather long trend retracement or is it a retracement of a new larger trend of zero or negative growth?”. The answer – as it emerges – will relate to future changes in population size and per capita car travel (see further below).
Is licence holding by young people in decline?
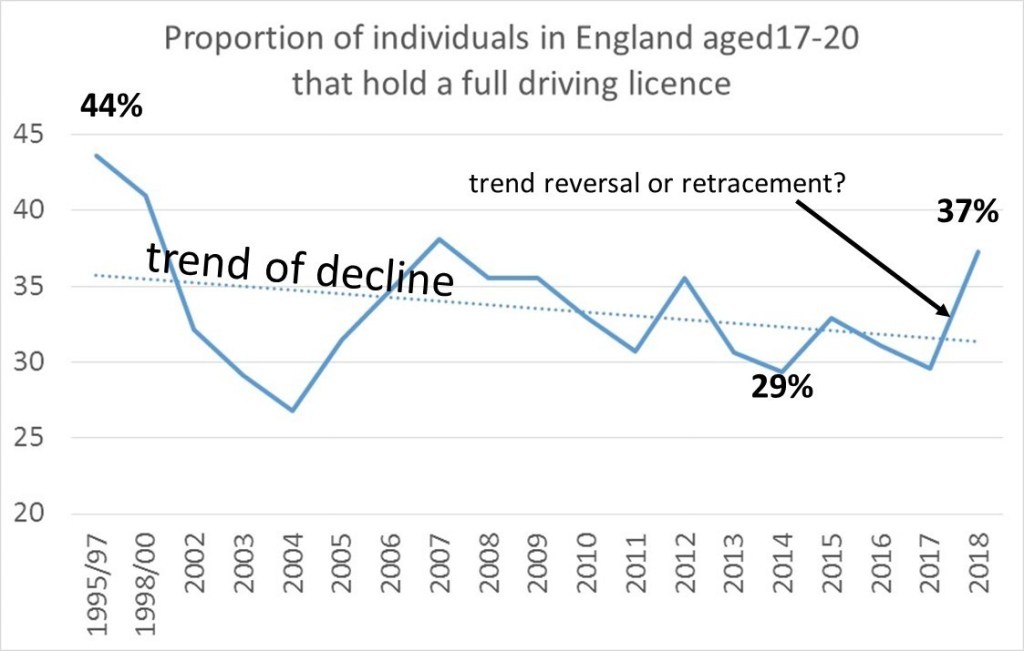
An excellent piece of work led by my UWE colleague Kiron Chatterjee for the DfT, empirically examined young people’s travel behaviour over time. In their report, the following stuck in my mind: “29% of all 17-20 year olds had a full driving licence in 2014 compared to 48% in 1992/94”. Young people’s licence holding declined significantly, indeed substantially, over this period. However, has this meant that it has been, and is, following an ongoing trend of decline? The graph below (based upon DfT’s data table NTS0201) shows how licence holding (in England) between 1995/97 and 2018 has changed. In 1995/97, 44% of 17-20 year-olds had a licence. In 2014 this was down to 29% (as noted above). However, in 2018, licence holding for this age group was back up to 37% (the highest for just over a decade). The trendline shows decline but is 2018 simply a trend retracement or might it be a trend reversal emerging?
Is car trip rate falling?
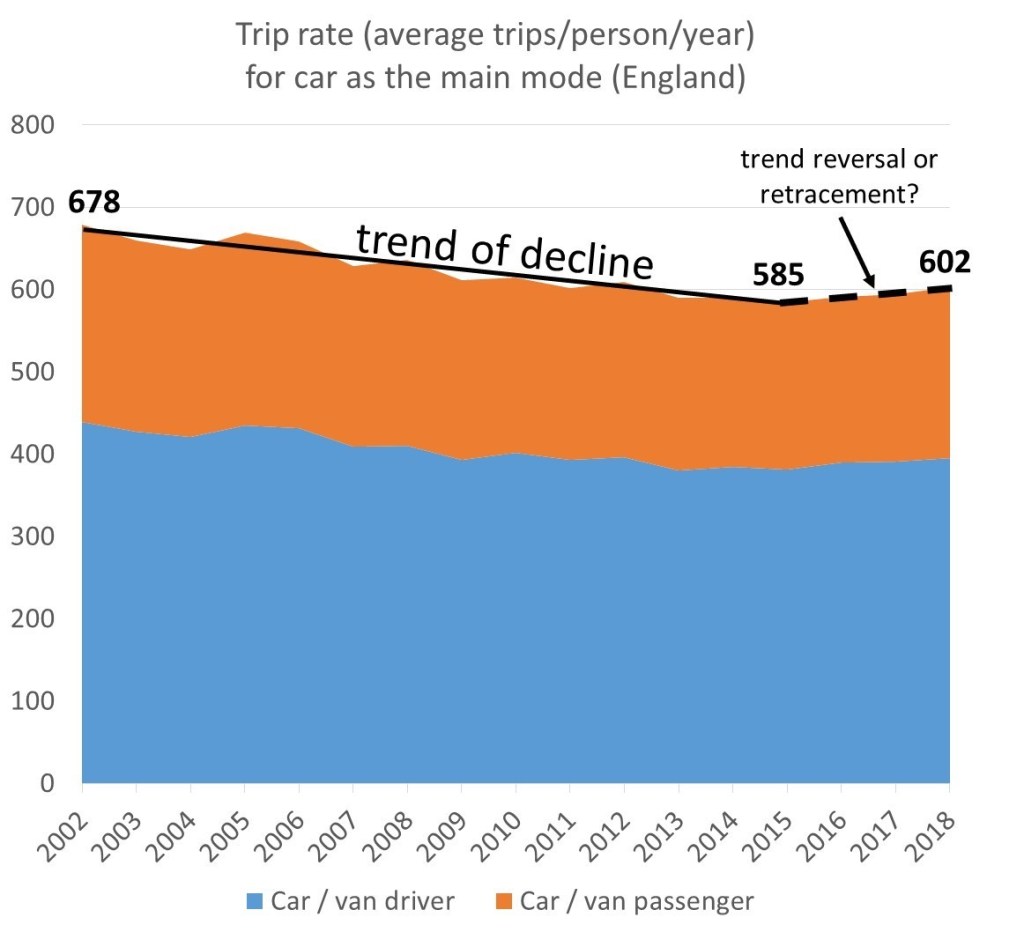
In 2002 (drawing upon data table NTS0303 from DfT), average trip rate as car driver or car passenger was 678 trips/person/year. This was followed by a trend of decline, reaching 585 in 2015 (a 14% reduction) – as shown in the graph below. DfT in its 2015 road traffic forecasts included a forecast scenario to 2040 reflecting an extrapolation of trip rate decline. In its 2018 road traffic forecasts it also included such a scenario to 2050 which in addition assumed further decline in young people’s licence holding.
However, from 2015 to 2018 there have been (modest) year on year increases in car trip rates – with a rate of 602 in 2018 (a 3% increase compared to 2015). Car trip rate is no longer in decline but is this recent development a trend reversal or a trend retracement?
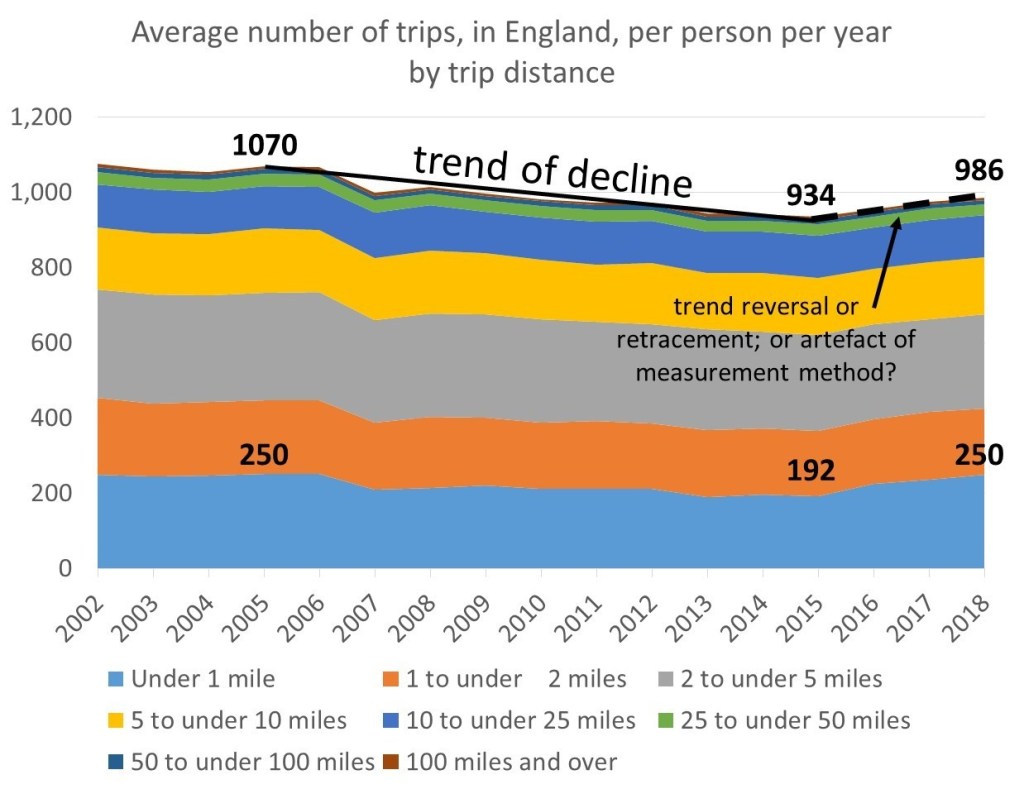
In passing, the additional graph below (drawing up DfT’s NTS0308 data table) shows change in overall trip rate (all modes) and according to trip distance bands. There was a 13% reduction in overall trip rate from 2005 to 2015. From 2015 to 2018 overall trip rate (all modes) has also increased – by 6%. This has been driven largely by a 30% increase in trip rate for trips under 1 mile (most of which are walked). I have separately written on LinkedIn about a possible renaissance in walking. It should be noted that the national travel survey methodology for recording short walking trips changed from 2015. This may explain some of the trip rate increase (though figures have been backwards adjusted by DfT in the NTS data used here). However, taken at face value, overall trip rate is also no longer in decline and we are seeing a trend retracement if not a trend reversal.
Summarising matters
In 2014 I wrote a paper called ‘Transport’s digital age transition’. In this I suggested – and have maintained subsequently – that the regime of automobility has been destabilising and that we are some years into a fundamental regime transition for mobility (born of the digital age colliding and merging with the motor age). Being in a state of transition helps explain the deep uncertainty we are feeling about the future and the associated dynamics of mobility.
The apparent lack of clarity in terms of being able to distinguish at this stage between trend reversals and trend retracements underlines the predicament for our forecast-led paradigm of transport planning in which anticipating the future has – to some significant extent – informed policy and investment decisions. The messiness of change looks set to continue for the foreseeable future. However, in returning to the opening phrase of the article – ‘changing mobility’, it is appropriate to provide a reminder that mobility not only changes but can be changed. The dynamics and perhaps turbulence highlighted in the article suggest a mobility system that is in a particularly malleable phase. We have a chance to capitalise on this to shape it for the better. There is an urgent need to do so in the face of the climate emergency.

Leave a comment